![Vivid Logo-2.png]](https://boarding.hellovivid.com/hs-fs/hubfs/Vivid%20Logo-2.png?height=50&name=Vivid%20Logo-2.png)
Vivid POS allows you to have quick access to all the essential reports, making it easy for you to run the business smoothly. You can quickly review the employee sales report, cash drawer report, weekly time report, and more by just clicking the ![]() button on the POS. Included below is the high-level breakdown of all the reports that you can see on the POS. You can just set them for a view for a particular date range, analyze the data and use it to control the restaurant operations the way you want.
button on the POS. Included below is the high-level breakdown of all the reports that you can see on the POS. You can just set them for a view for a particular date range, analyze the data and use it to control the restaurant operations the way you want.
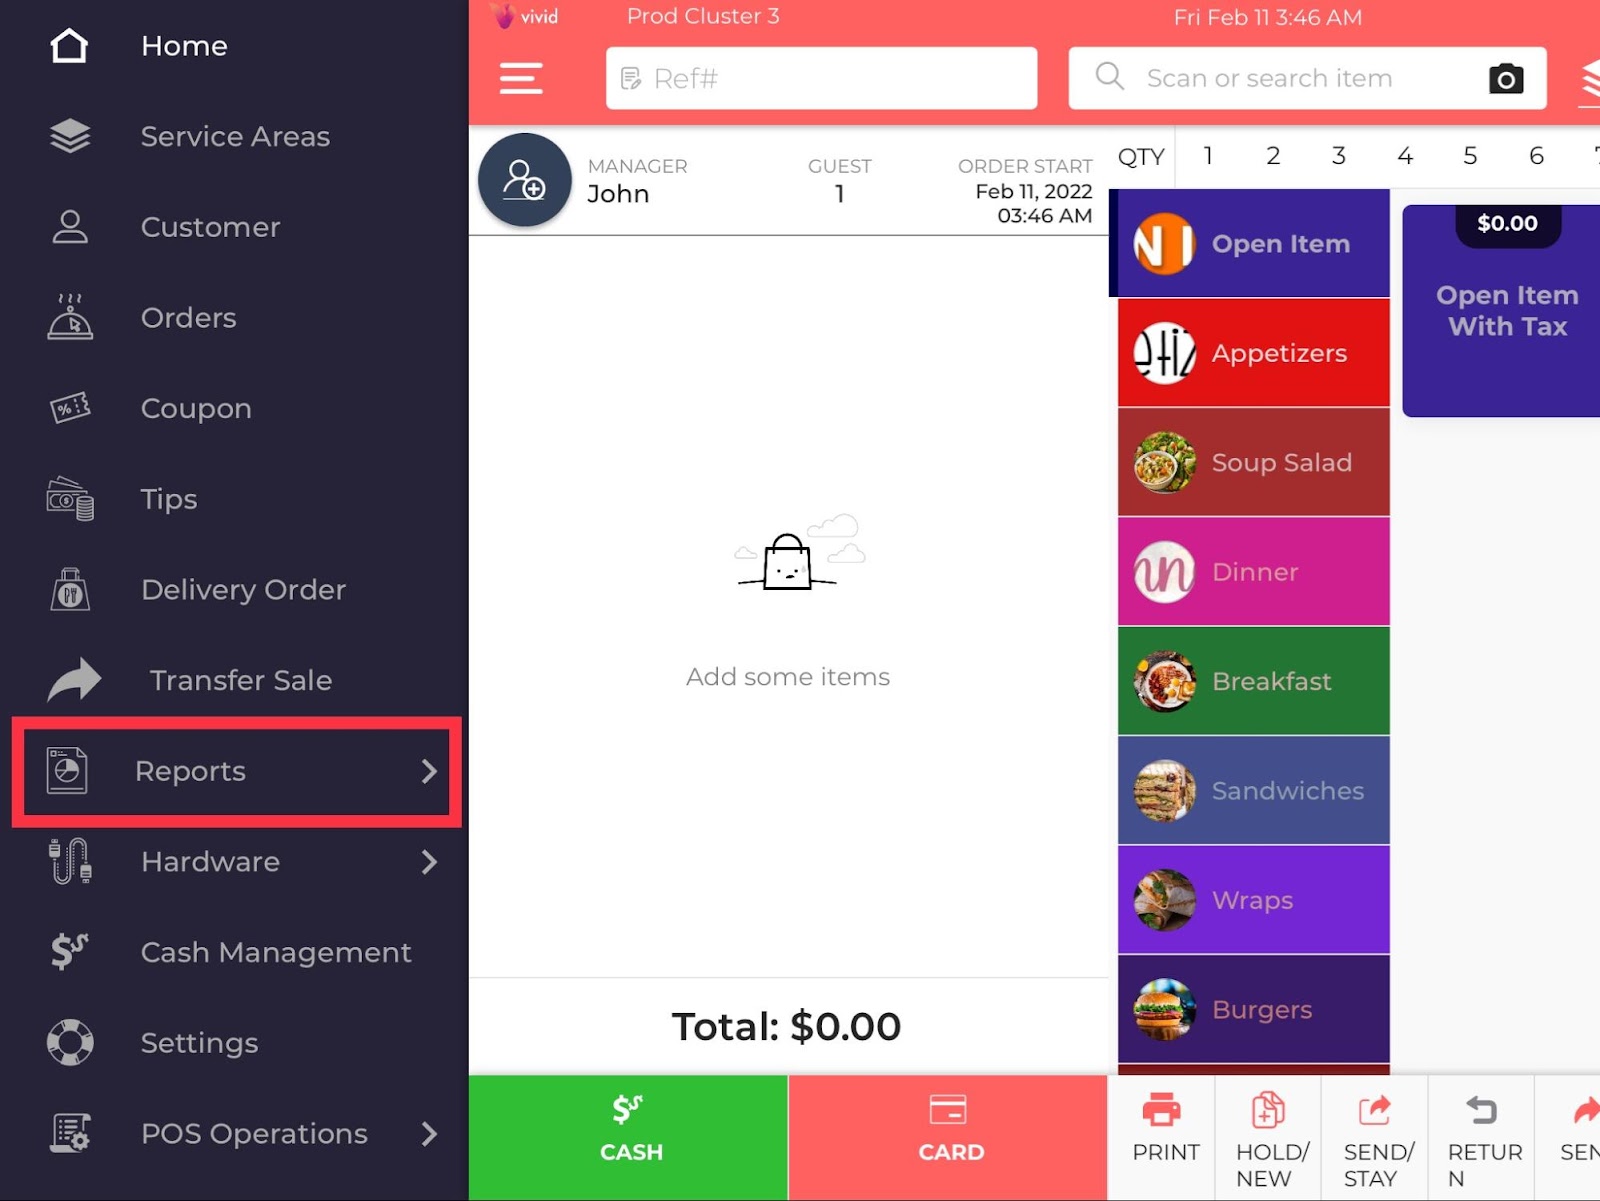
Tap left navigation bar. Click Reports as shown in the image.
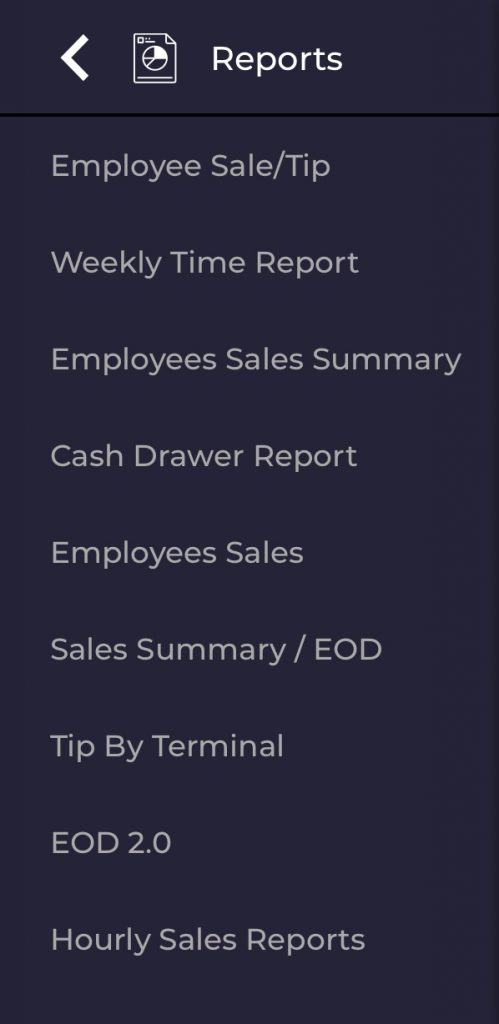
The list of available reports will open on the left. Following are the reports you will see on your POS screen.
-
Employee sale/tip.
-
Weekly time report.
-
Employee sale summary.
-
Cash drawer report.
-
Employee sales.
-
Sales summary/EOD.
-
Tip by terminal.
-
EOD 2.0
-
Hourly sales report.
Employee Sales/Tip Report
This report informs about the sales made by each employee during a particular date range. The following is an illustration of how a typical employee sale/tip report looks like. This report consists of five sections- Emp, Sale, Cash, Credit, and Tip, all of which have different means and purposes. Below you will explore them in detail.
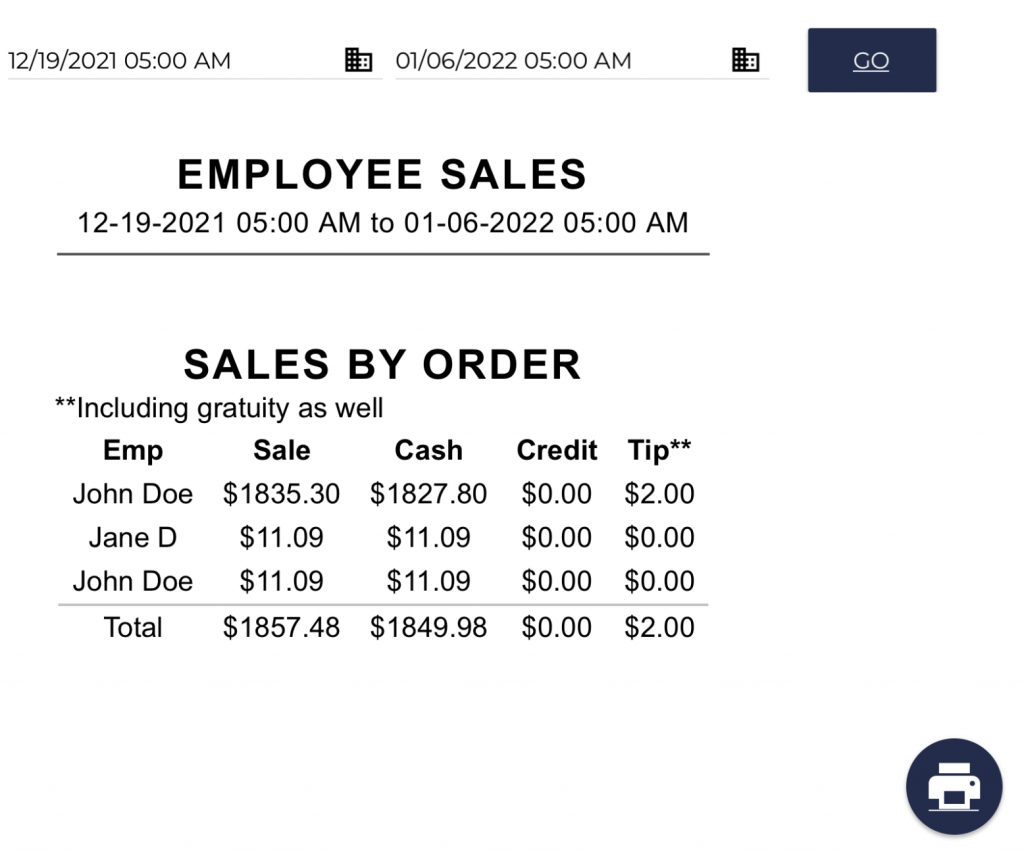
Set the From and To date from the date-pickers at the top of the report. Once you have made the selection, click Go.
Employee sale/tip report consists of the following sections.
Emp – This is the employee under analysis.
Sale – This is the total sale made by an employee during the selected date range.
Cash – This is the sale made by an employee in cash.
Credit – This is the sale made by an employee in credit.
Tip – This is the total tip earned by an employee. It includes the gratuity amount as well.
You can also print the reports by clicking the button at the bottom right corner.
Weekly Time Report
This is a role-based weekly report that informs about the working hours of any role including the current clocked in or clocked out the status of that role.
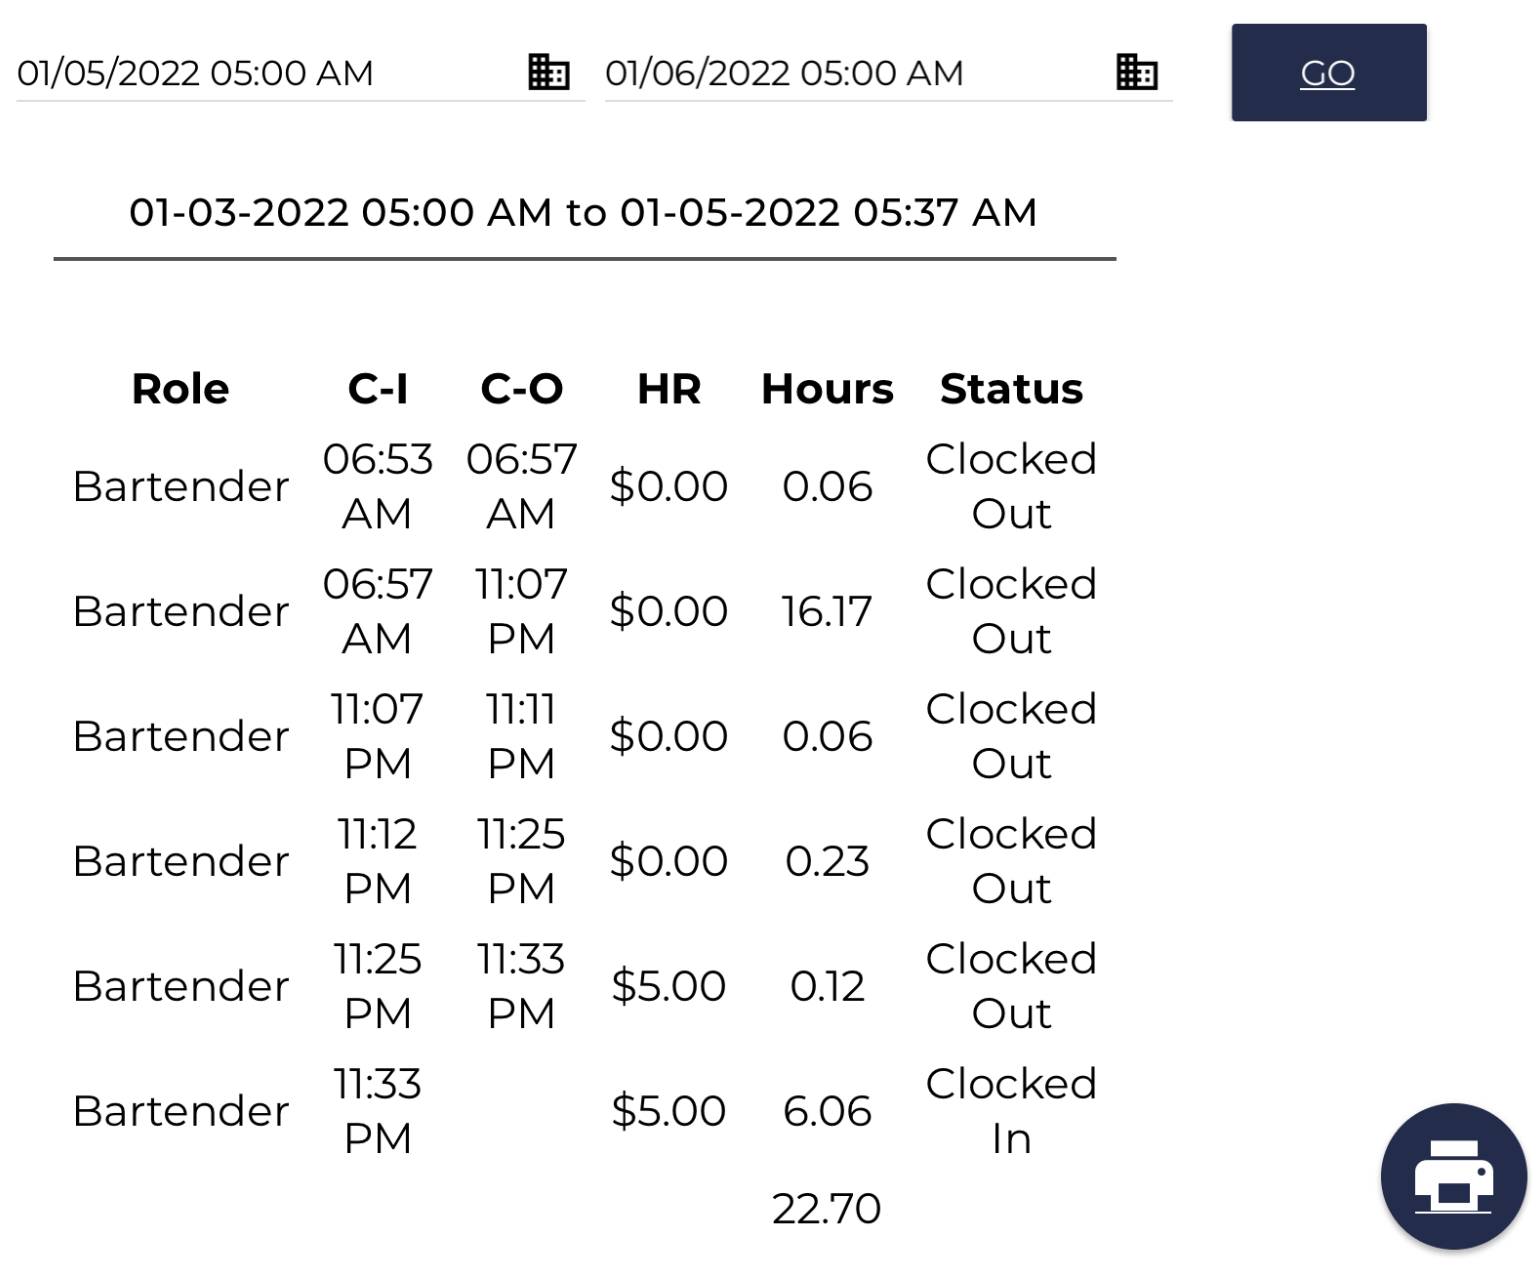
Set the From and To date from the date-pickers at the top of the report. Once you have made the selection, click Go.
The weekly Time report consists of the following sections.
Role – This is the employee role under analysis.
C-I – This is the clock-in time of the employee in this role.
C-O – This is the clock-out time of the employee in this role.
HR – This is the hourly rate of this role. You can set this rate from the Assigned Role section under Employee Management.
Status – This is the current clock in/clock out status of the role under analysis.
You can also print the reports by clicking the button at the bottom right corner.
Employee Sales Summary Report
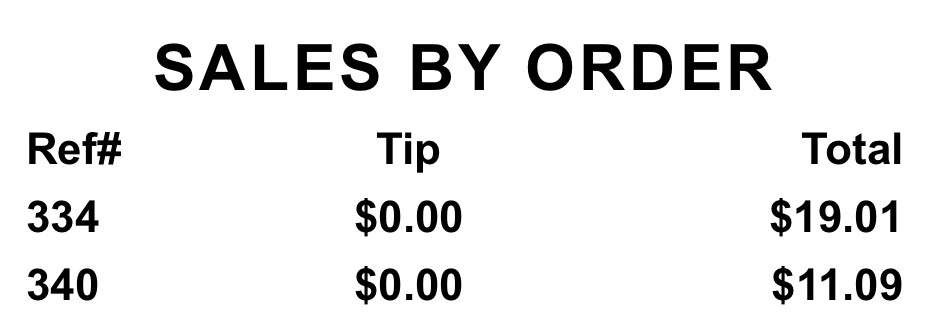
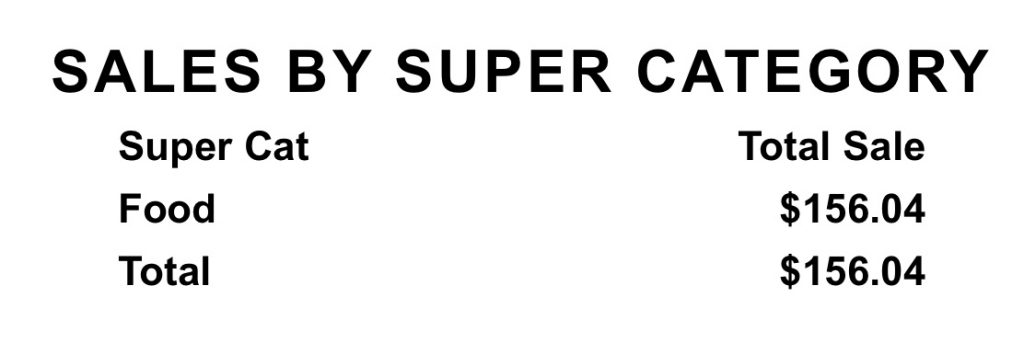
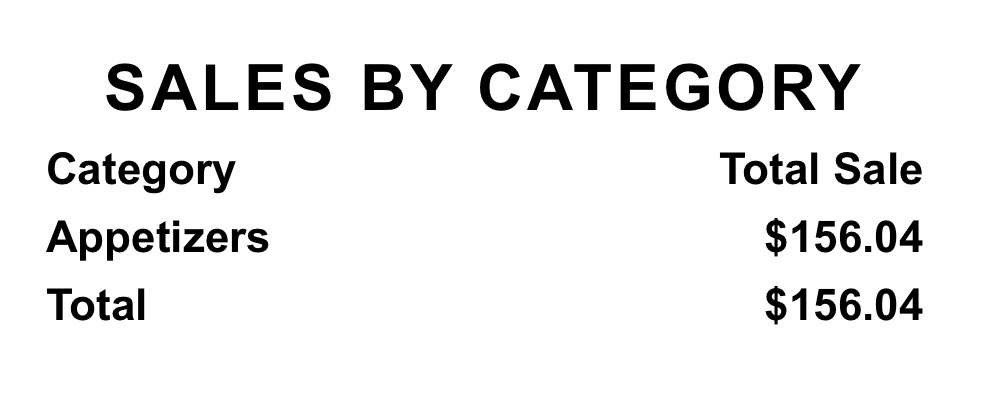
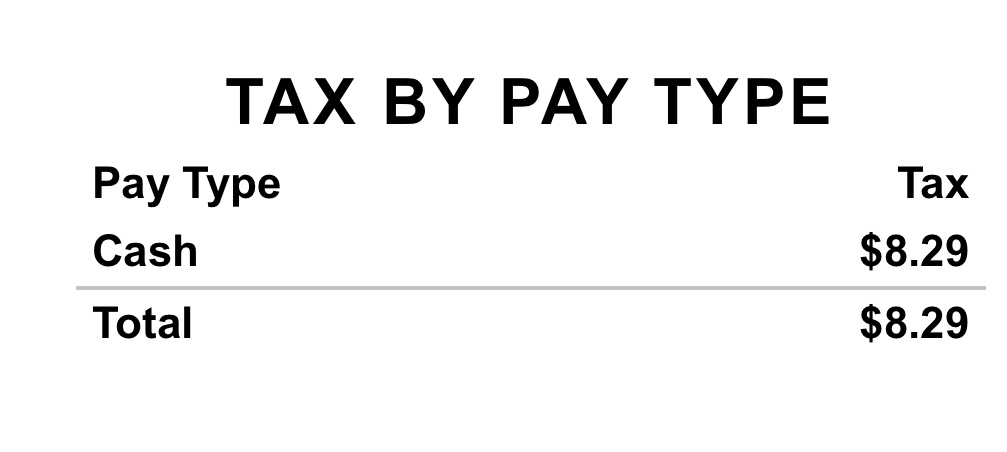
The employee sales summary report is the most utilized report often used by restaurant owners and managers to review the sales made by an employee. You can get a high-level overview of the Sales by Order, Super Category, Category, Pay Type, and Card Type. Getting started is simple, just set the date range and you are good to go. Below you can see the multiple sections of the employee sales summary report and the breakdown of each section.
Sales Statistics
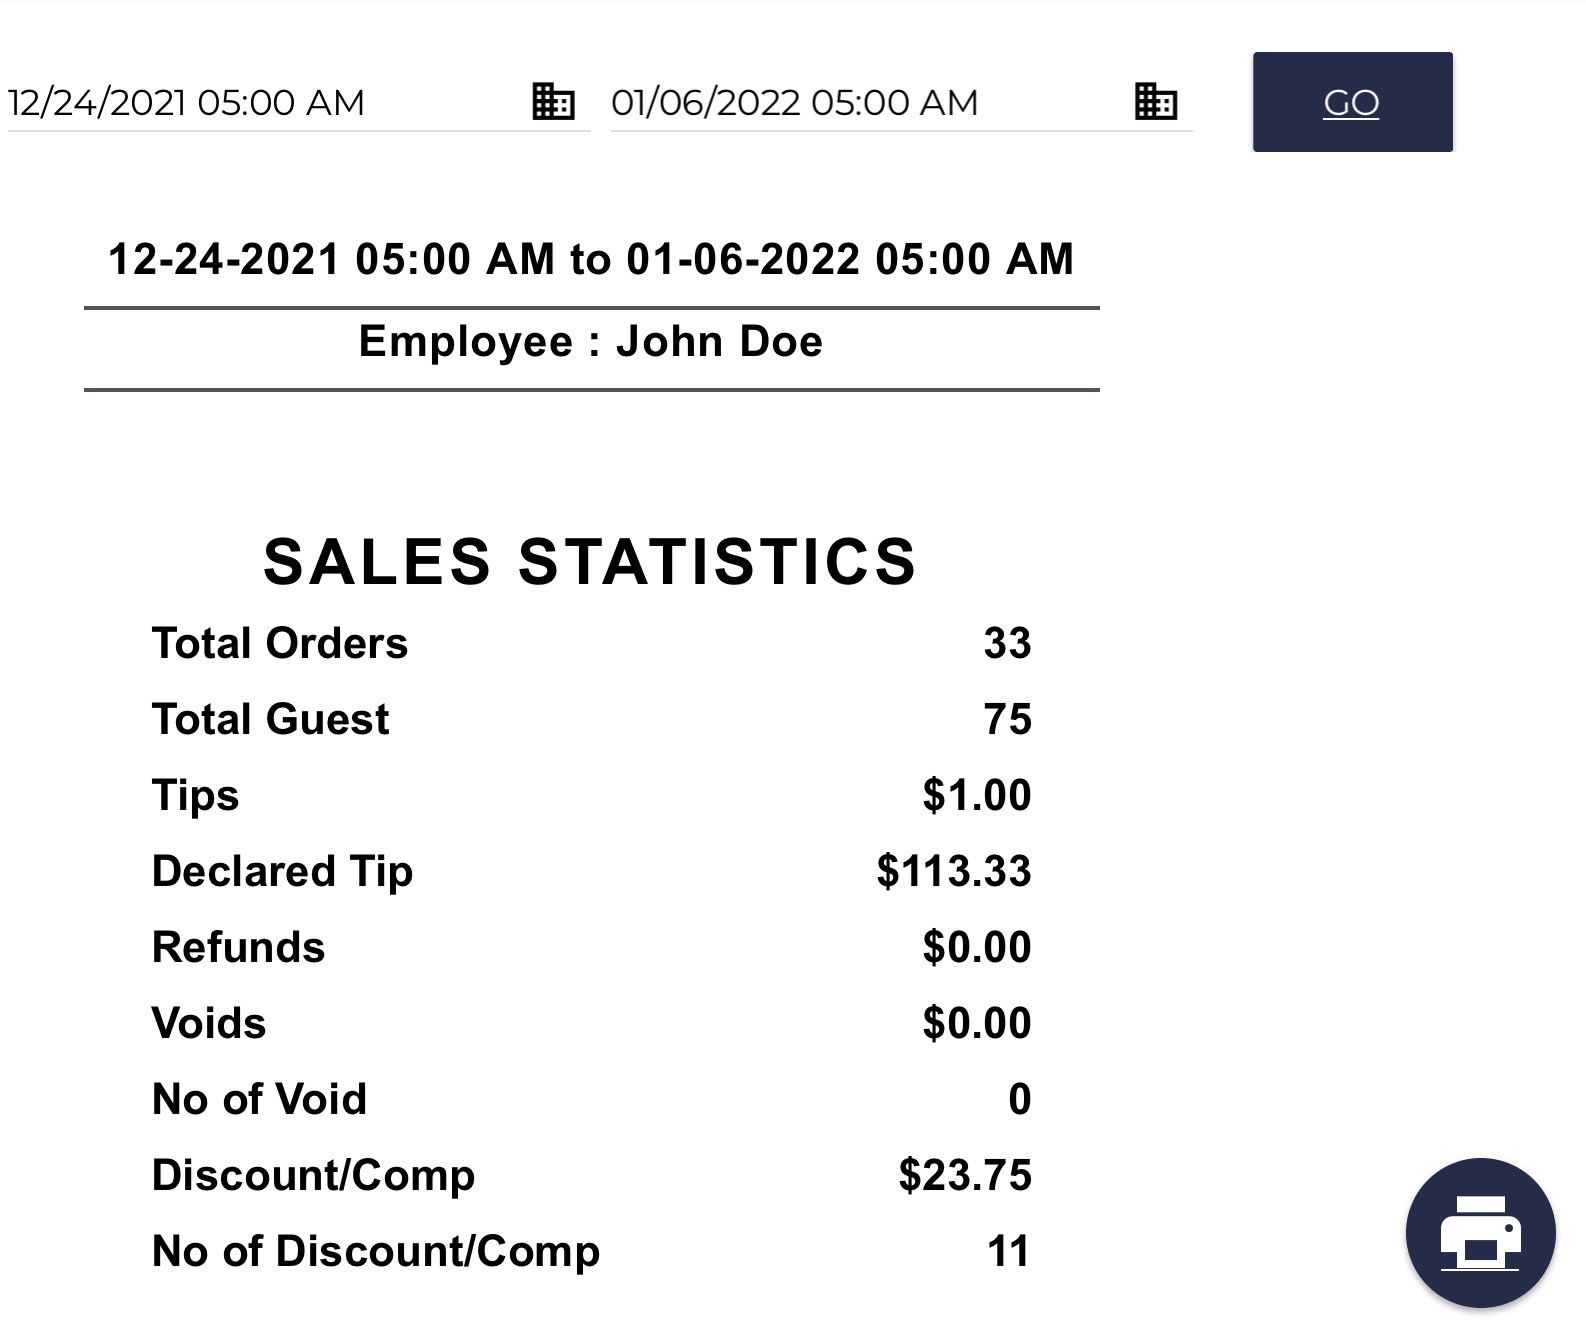
Sales Statistics is the first report you will see Employee Sales Summary. It consists of the following stats.
Total orders: Total orders this employee has served under the selected date range.
Total Guests: Total guests the employee has served during the selected date range.
Tips: This is the total tip amount the employee has earned during the selected date range.
Declared tip: This is tips declared by an employee at the time of clock out during the selected date range. Please make sure to mark the Enable Declare Tip on Clock Out privilege for this employee from the Access Management section.
Refunds: This is the total refund amount initiated by an employee during the selected date range.
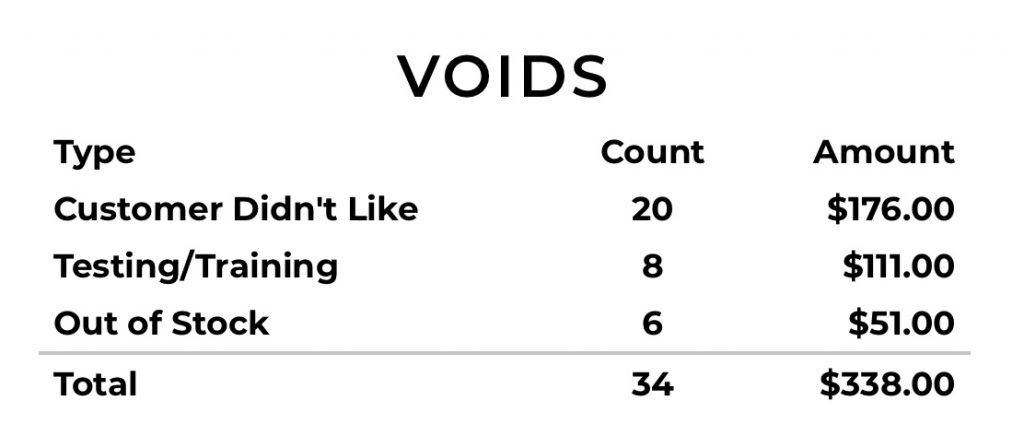
Voids: The cost of an order voided by an employee during the selected date range appears here.
No of voids: This is the total number of orders voided by an employee.
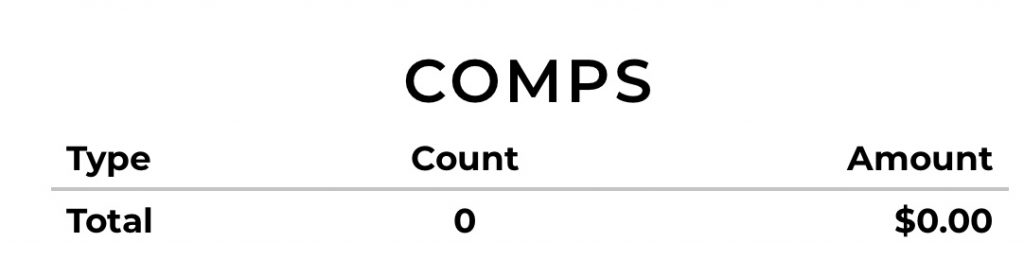
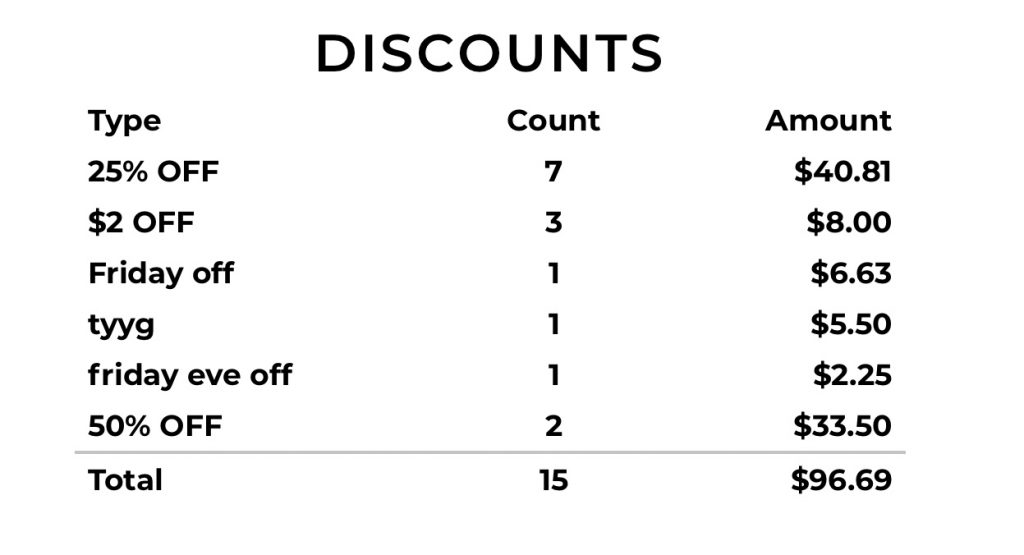
Discount/Com: This is the total Discount/Comp amount initiated by an employee.
No of discount/comp: This is the total number of discounts/cops initiated by this employee.
Cash Out
Cash Out report provides information about cash withdrawal by an employee from active or open drawers. This feature is typically used when there is excess cash in the drawer, and it needs to be transferred to another safe location.
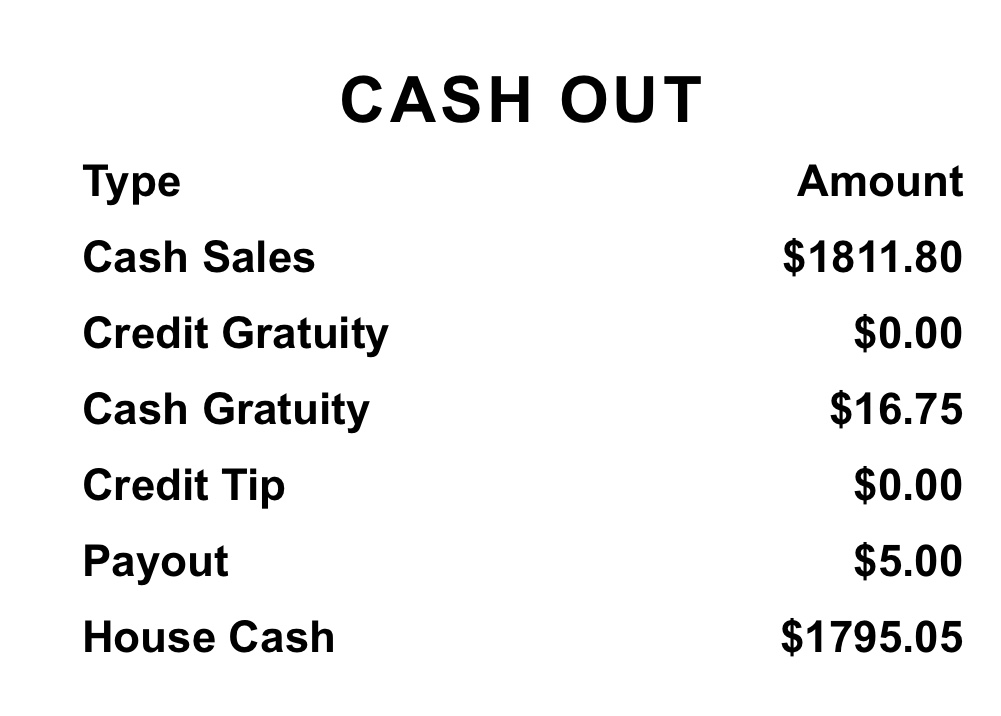
Cash Sales: This is the total sales in cash.
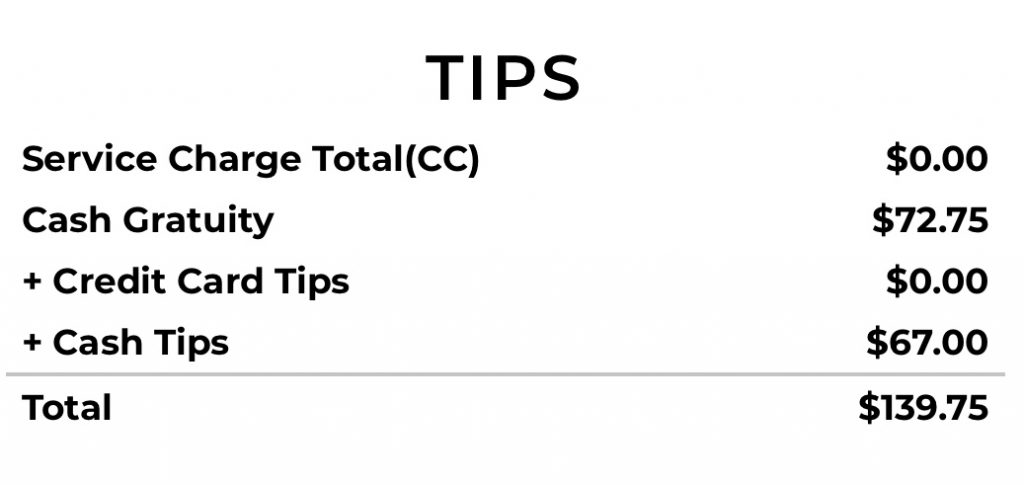
Credit Gratuity: This is a service charge gratuity added using a credit card.
Cash Gratuity: It is the service charge gratuity for orders that are settled in cash.
Credit Tips: This form of tip includes credit card tips or any other tips accumulated from any non-cash payment. It is given in cash to the employees at the end of the day.
Payout: This is the money paid by this employee to someone in exchange for goods or services. For example, money paid for repairs, to suppliers, etc.
House Cash: This is the total credit balance added by this employee.
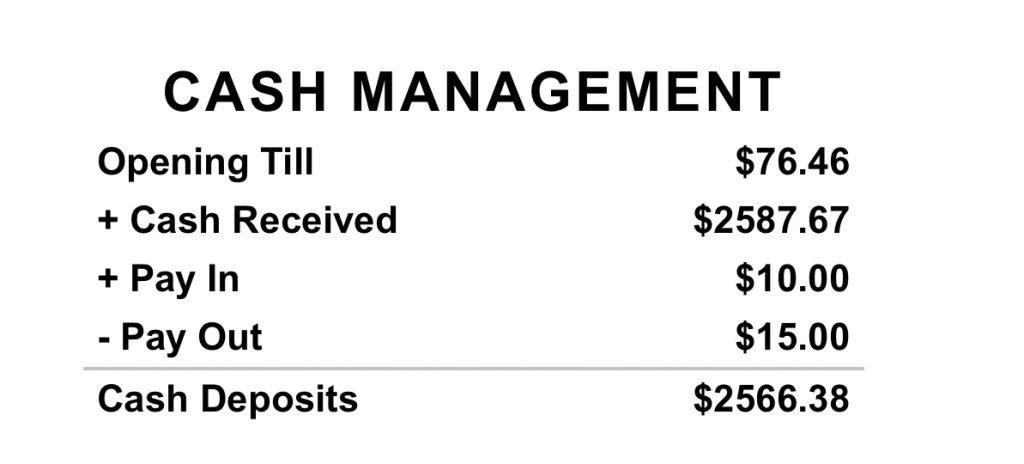
Cash Management
This data informs you about the cash management by an employee. This section of the report shows the Opening Till amount in the cash drawer, Cash received, Pay In, Pay Out, and the final Cash deposits. The final cash deposit is calculated in the last row after subtracting the Pay Out and Tip amount.
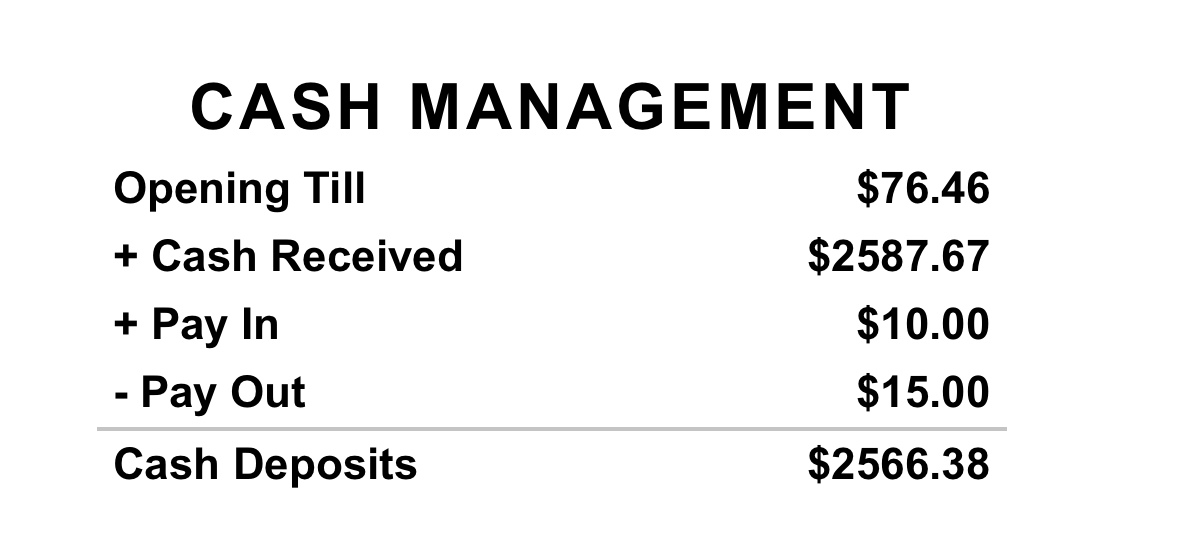
Opening Till: This is the opening amount in the cash drawer during the chosen date range.
Cash Received: This is the total cash received by an employee against orders during this selected period.
Pay In: This is the cash paid to the cash drawer.
Pay Out: This is the money paid by this employee to someone in exchange for goods or services. For example, money paid for repairs, to suppliers, etc.
Cash Deposits: This is the final cash deposited in the cash drawer.
It refers to Opening Till + Cash Received + Pay In – Pay Out – Tip.
Other Reports
Other reports that employees can take a glance at are given below.
Cash Drawer Report
The Cash Drawer report helps you track the cash flow in the cash drawer.
Starting Cash: This is the starting balance in the cash drawer. We also call it Till amount.
Cash Sale: These are cash transactions record orders paid for in cash.
Pay In: Pay In is used to track the amount added to the cash drawer.
Pay Out: Pay Outs are used to track the money that is paid to someone in exchange for goods, services, or any specific reason. For example, money paid for repairs or suppliers, etc.
Tip Out: This is the cash given from an active drawer for tips or gratuities to the employees.
Expected Closeout Cash: This is the expected amount in the cash drawer at the closeout calculated by the POS.
Actual Closeout Cash: This is the actual amount found in the cash drawer at the closeout.
Over: If actual cash is greater than the expected cash.
Under: If actual cash is less than the expected cash.
EOD 2.0
This version of the EOD reports informs about the sales and tax summary, gross/net sales by super-category, etc. Below is the breakdown of the EOD 2.0 report.
Sales and Tax Summary
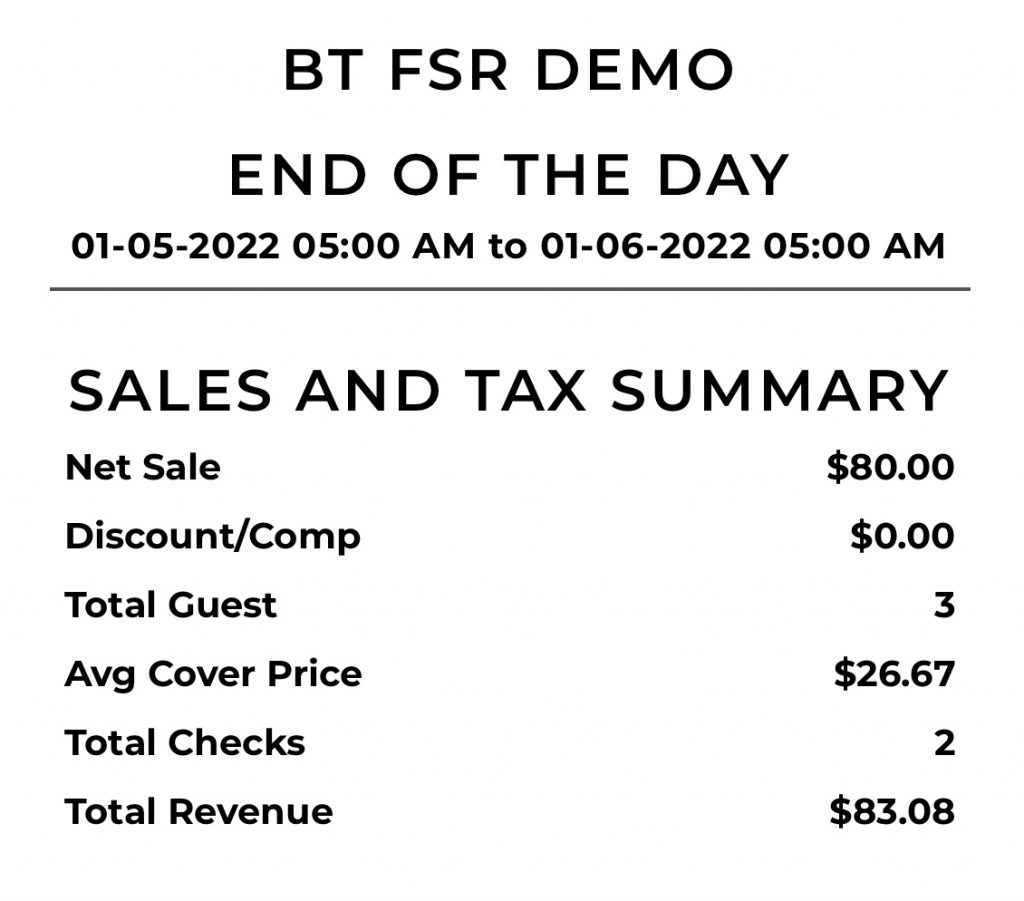
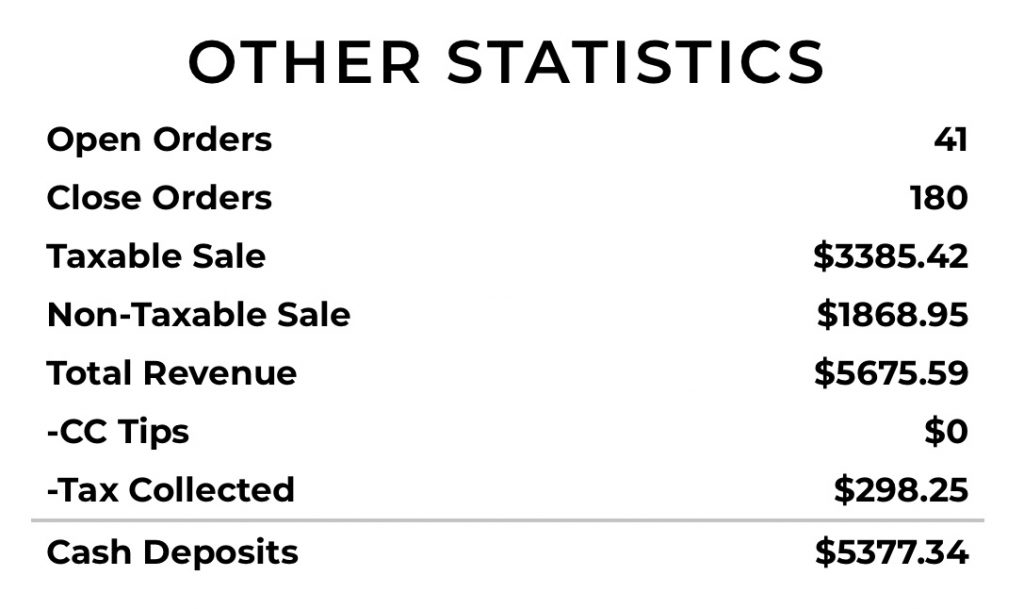
Net Sale: This is the total sales made (excluding taxes) in cash or credit during the selected report range.
Discount/Comp: This is the discount or comp amount offered during the selected report range.
Total Guest: This is the number of guests served during the selected report range.
Total Checks: This is the total number of checks.
Total Revenue: This is the net sale plus tax amount.
Gross Sales and Net Sales by Super Category
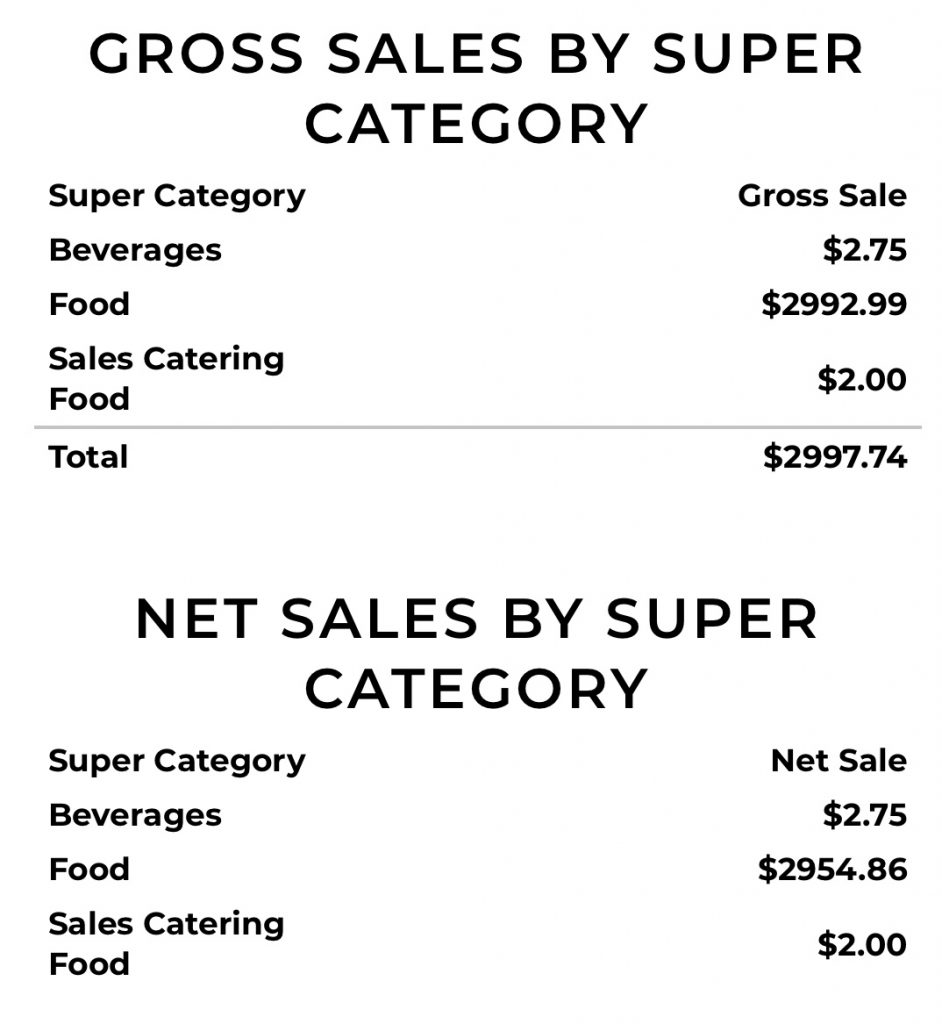
This section of the EOD report informs about the Gross Sales by Super Category. The super categories sold are lined up on one column, and the price of items sold (excluding taxes) within that super category is displayed in the adjoining section. This report is a great source of information in that you get to know which super-category is the most selling in your restaurant so that you can make sure the inventory of items in that super-category never falls short.
Another report underneath displays the net sales by super category. This section of the report is inclusive of the taxes.
Taxes
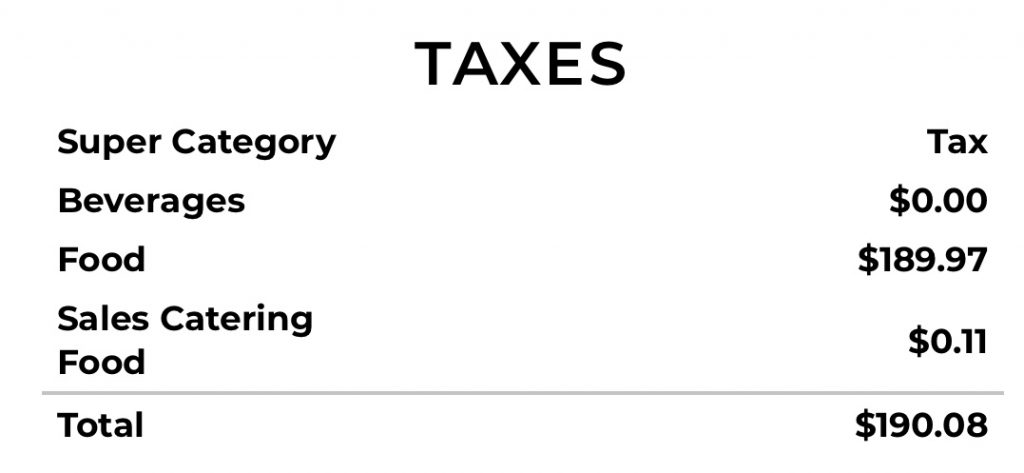
This section of the EOD 2.0 report tells about the taxes paid against items sold in each super-category. The cumulative total of the taxes paid is displayed at the bottom.
Net Sales by Revenue Centers
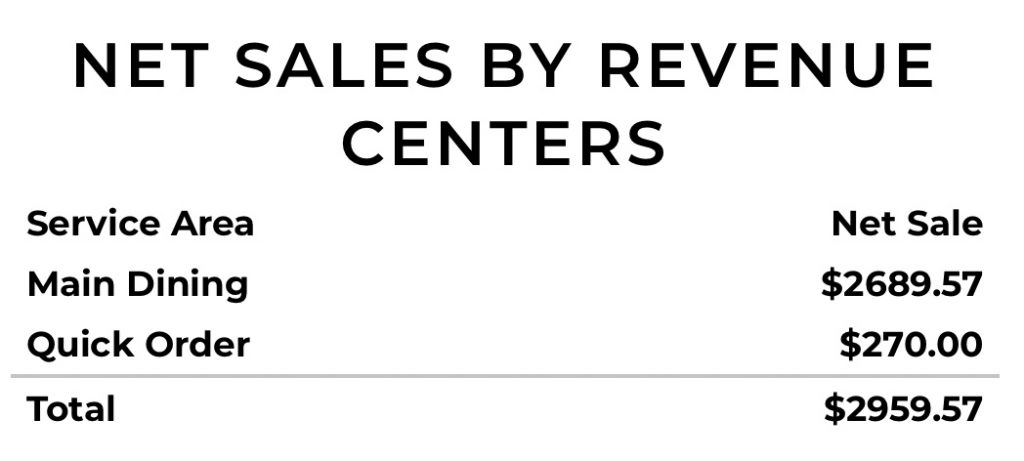
Now keep track of the service area generating most sales with Net Sales by Revenue Center report. Here you can get more profound insights into which revenue center generates the most sales and which one the least. The net sales generated by a service area is displayed in the adjoining section. This helps you in strategizing the way you run your restaurant.
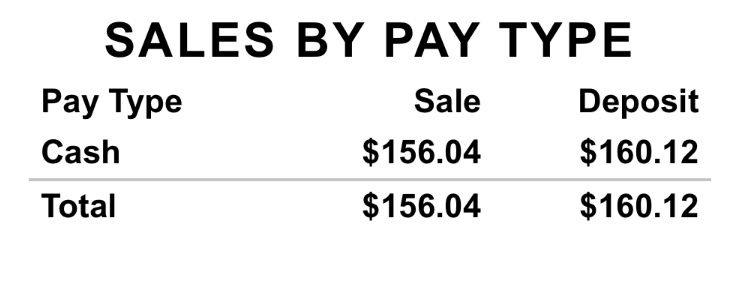
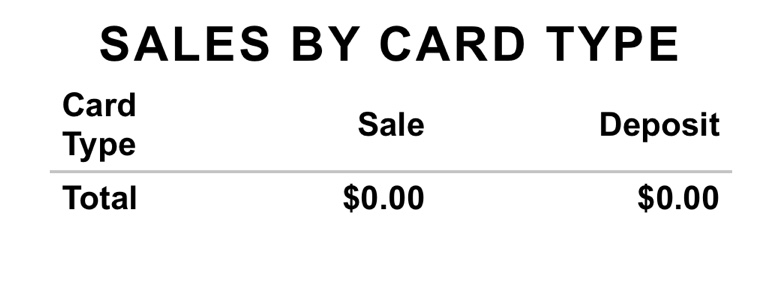
Transactions by Tender Types
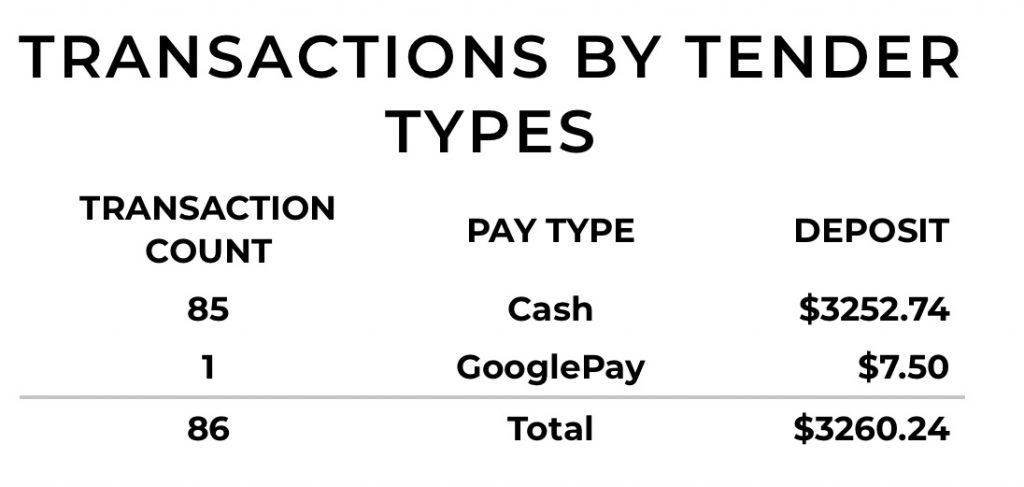
This report helps you keep track of the Pay Type that guests have most often used to pay for their orders. The Pay Type can be cash, credit, EBT, GPay, Gift card, coupon, etc.
Cash Drawers
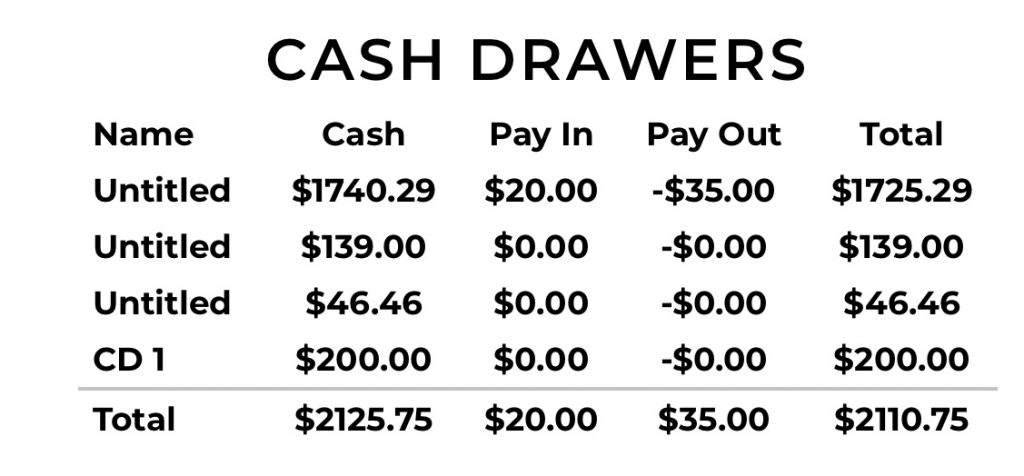
Cash Drawer report informs about the cash flow in each drawer during the selected report range. The cash flow details- cash, pay in, and pay out displays adjacent to each cash drawer.
Cash Management
This data informs you about the cash management by an employee. This section of the report shows the Opening Till amount in the cash drawer, Cash received, Pay In, Pay Out, and the final Cash deposits. The final cash deposit is calculated in the last row after subtracting the Pay Out and Tip amount.
Opening Till: This is the opening amount in the cash drawer during the chosen date range.
Cash Received: This is the total cash received against orders during this selected period.
Tips: This is the total amount of cash received during the selected time period.
Pay In: This is the cash paid to the cash drawer.
Pay Out: This is the money paid for goods or services. For example, money paid for repairs, to suppliers, etc.
Cash Deposits: This is the final cash deposited in the cash drawer.
It refers to Opening Till + Cash Received + Pay In – Pay Out – Tip
Other Reports